Using No-Code to Boost Analytics and Build Profits in P&C Insurance
While AI and Machine Learning (ML) are at the forefront for nearly every industry, it’s the advanced analytics behind them that set the foundation for P&C insurance growth.
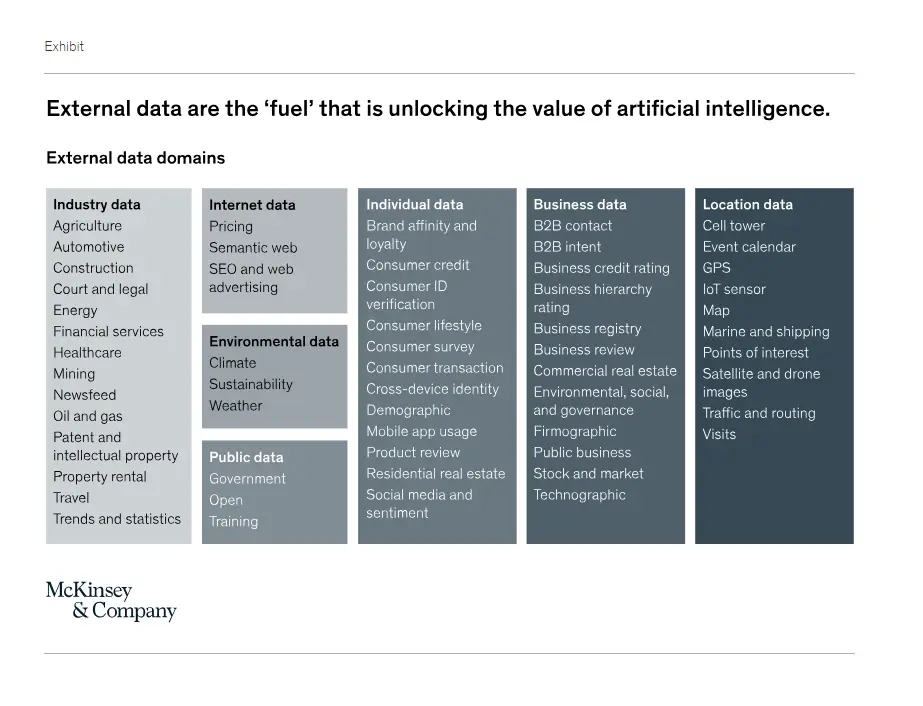
Leading carriers are tapping into vast amounts of third-party data and developing effective models within their tech stacks. This expansive information is fueling profitability and keeping carriers ahead of their competitors.
Not every P&C insurer is ready or able to adopt AI and machine learning. Most, however, could at least improve their analytic capacity and financial outlook without much disruption. So, the questions we need to ask are:
- What channels are insurers using to get their products to market?
- What role is analytics playing within these channels?
- How can insurers improve their analytics using a no-code tech stack?
Channels for P&C Insurance Distribution
Insurers have a vast network of distribution channels available to get their products to market. Let’s briefly look at each of these.
- Direct-to-Consumer Marketing (i.e. call centers)
- Captive Agencies
- Independent Insurance Agencies
- Brokerages
Direct-to-Consumer Marketing
Direct-to-consumer carriers employ lots of call center customer representatives who can close the sale or transaction right on the phone. Customers can connect to a representative to make changes to an existing policy or purchase a new policy.
A call center representative functions just like an insurance agent; in fact, most are licensed insurance agents. Direct-to-consumer carriers save the commissions they would pay an independent agent to sell a policy, which enables them to offer lower premiums and allocate more money for advertising.
Examples: GEICO and Progressive
Captive Agencies
Captive Agencies function just like independent agents, except the products they offer come from one insurance carrier.
Often, captive agents are actually employees of the captive insurance company, and they earn a salary (plus a bonus) for the amount of business they write.
Examples: State Farm, Allstate, Farmers, Nationwide
Independent Insurance Agents
Independent insurance agents are licensed agents who have contracts with multiple insurance carriers and can offer customers policies from carriers that best meet their insurance needs.
Often, independent agents can offer better pricing, better coverage, or more workable billing plans. One advantage for carriers using independent agents is that they don’t incur the expense of setting up an independent agency. Independent carriers agree to pay independent agents a commission on every policy sold.
Brokerages
Brokerages are insurance agents with access to multiple insurance carrier markets. These distributors are generally specialists in specific kinds of insurance or in complex or difficult to place insurance.
Some examples where brokers are better options include large construction projects that require many different types of insurance coverage such as general liability, workers compensation, products and completed operations, surety bonds, equipment coverage, and others.
An experienced broker can serve as a one-stop resource who can handle all these specific insurance needs. Typically, a large brokerage has access to insurance carriers around the world.
Capturing Data for Analytics
| Direct-to-Consumer | Captive Agencies | Independent Insurance Agents | Brokerages |
|---|---|---|---|
|
|
|
|
If the carrier is leveraging third-party data from government databases, weather services, and industry-specific datasets, that is another sticking point for the analytics strategy.
How can each of these distributor types optimize their data collection for analytics? Here are some ideas:
Brokerages
Brokerages, serving as intermediaries between insurers and clients, can improve data collection by standardizing data entry protocols to ensure consistency.
Integrating brokerage management systems with carrier systems through APIs allows for real-time data sharing, enhancing data accuracy. Additionally, leveraging customer relationship management (CRM) tools helps gather detailed client information and track interactions, providing a comprehensive view of client activities.
Direct-to-Consumer
Direct-to-consumer (DTC) channels can enhance data collection by utilizing digital platforms to capture comprehensive customer data directly from online interactions. Employing advanced analytics on web traffic, click-through rates, and user behavior provides valuable insights.
Implementing robust data management systems ensures the integration and proper handling of data collected from various touchpoints, facilitating a seamless flow of information.
Captive Agencies
Captive agencies, representing a single carrier, can improve data collection by using unified software systems provided by the carrier to ensure data uniformity and accuracy. Regular training programs for agents on the importance of accurate data entry and collection can also enhance data quality.
Additionally, integrating feedback mechanisms within the agency’s operations helps capture client experiences and preferences effectively.
Independent Agents
Independent agents, working with multiple carriers, can adopt multi-carrier management systems to streamline data collection across different insurers. Encouraging the use of standardized forms and templates helps maintain data consistency.
Implementing cloud-based solutions for data storage and sharing ensures that collected data is easily accessible and up to date, enabling more efficient data handling and analytics.
No-Code for Advanced Analytics
Finding ways to capture this data is one challenge. A meaningful way to visualize and analyze it is another.
Ideally, it would be best to perform a study to determine the most important metrics that would be used to make decisions on the business and to have several templates built so data could be pulled and dropped into these templates on demand.
There are many off-the-shelf BI tools available to perform these functions, but most of them require some level of coding capability. A more efficient way to perform these functions is with a robust no code application that anyone in the company can use.
A no code platform can integrate with existing applications to automate workflows that match the advanced analytics needs. Additional IT support is minimal, since, as the name implies, the capabilities are designed to be used without coding knowledge.
Adopting a no code CRM helps capture timely analytical data and unify it for reporting and analysis.
Integrating the tools you already have into a centralized platform like no code CRM is a cost-effective route to supporting a broad analytics strategy. The user-friendly capabilities make it easy for distributors and internal teams to work together towards a common goal and see the real-time analytics related to their actions.
After the insurer stabilizes profits and begins to reap the benefits of the analytics strategy, there’s more wiggle room for large AI and machine learning undertakings.
In the meantime, democratizing data entry and access, lowering IT dependencies, and capitalizing on the data you already have are the starting points for building that profitability.
Analytics in Action
| Key Metric / Agency Code | 2343 | 0041 | 6590 | 3254 | 9852 |
Line of Business
Private Passenger Auto
| In-Force Premium | 340,000 | 1,320,000 | 2,780,000 | 859,000 | 786,000 |
| Policies In-Force (PIF) | 185 | 567 | 1452 | 790 | 402 |
| New Business Bind Ratio | 12% | 22% | 41% | 13% | 38% |
| Renewal Bind Ratio | 78% | 92% | 94% | 87% | 93% |
| Avg. Policy Premium | 1,838 | 2,328 | 1,913 | 1,087 | 1,955 |
| 3 Year Direct Loss Ratio | 31% | 76% | 21% | 16% | 87% |
| 3 Year DWP Trend | 112% | 8% | 18% | 170% | 76% |
In this example we can observe some important developments:
First, all five agencies are close in average policy premium except for the fourth agency, which seems to be roughly half the value of the others. One possible explanation could be that the composition of that agency portfolio consists of older, better drivers who are eligible for a lot of premium credit. More evidence that this could be true is the 3 Year Direct Loss Ratio of 16%. This is very good because it is much lower than average.
By contrast, the second agency has a high 3 Year Loss Ratio and is not a profitable portfolio at this rate of losses. In addition, the 3 Year Premium Trend is mediocre at 8% and is probably not keeping pace with carrier rate increases over this time period.
Lastly in this example we’ll look at the overall metrics for the third agency. Here, all the key metrics seem to be in very good shape. This agency is writing a lot of profitable business with low loss ratios, 21%. It has a high rate of closing business quoted (i.e. Bind Ratio) 41%; it has a high rate of premium growth over three years, 18%; and a high rate of policy retention, 94%. This agency is worth studying to determine how it can perform so well.
Using only a handful of key performance metrics, the analyst responsible for managing the agency plant can readily identify problem areas which he can address to restore an agency portfolio to profitability.
Moreover, the same analysis can help identify areas that are desirable and where the carrier will want to create more of this positive opportunity. All this can be accomplished using a no-code tool that is easy-to-use, accessible to anyone in the company, and doesn’t require unique programming skills. If you’re curious to learn more about the applications of such a tool, reach out to us.