Opportunities for AI & Machine Learning in Property & Casualty Insurance
- Identifying customer preferences
- Targeting messaging to selected customers
- Determining eligibility for insurance
- Tiering for pricing and underwriting
- Predictive evaluation for potential claims litigation
- Predictive analytics for assorted key metrics
The Power of Machine Learning in P&C Insurance
Within the machine learning category, there are several discreet types of technologies and methodologies used. For example:
Large Language Models (LLM) are used by 67% of companies to target messaging to customers.
Generalized Linear Models (GLM) are used by actuaries where “y” is the variable we wish to predict, and all the “xi’s” are the explanatory variables used in the algorithm.
Machine Learning Algorithms can be categorized into four groups:
- Supervised – models containing both inputs and desired outputs
- Unsupervised – models containing only inputs which then find structure in the data
- Semi-Supervised – a hybrid technique of supervised and unsupervised models using a little of both labeled and unlabeled data
- Refinement – method of excluding too high correlated and too low correlated data
In all cases, it is advisable to employ the “Goldilocks” rule for constructing predictive algorithms:
- Not too simple
- Not too complex
- Strike a balance between the two
A separate word about model complexity is important here. There is a big difference between constructing AI/ML models developed for internal use and models that are developed for commercial use and sale.
Models developed for internal use may not need to be as perfectly constructed or more generally understood than models developed for commercial use.
Commercial models must not be so complex that only the actuaries or data scientists who built them understand them and can explain them.
This is especially true for models used in the property & casualty insurance market. Insurance regulators will insist the models be explainable, do not have built in bias, and do not have a disparate impact on certain groups of insurance consumers.
Artificial Intelligence in P&C Insurance
There are formal data science and mathematical procedures used for constructing and testing AI models, and most models are constructed using the following sets of data:
- Training data
- Validation data or test data
Training data is data drawn from a large data set where most of it is used in construction of a predictive model. Here, the data scientists, actuaries, or analysts build a mathematical model or predictive model where they can test the precision and accuracy of their model.
Then, the validation model consists of a subset of data drawn from the same large set from which the training data was drawn. Only this data, often referred to as the “holdback” data set, is then used to see how “good” the model was at predicting desired outcomes.
Two common phenomena occur when constructing predictive data models:
- Overfitting
- Underfitting
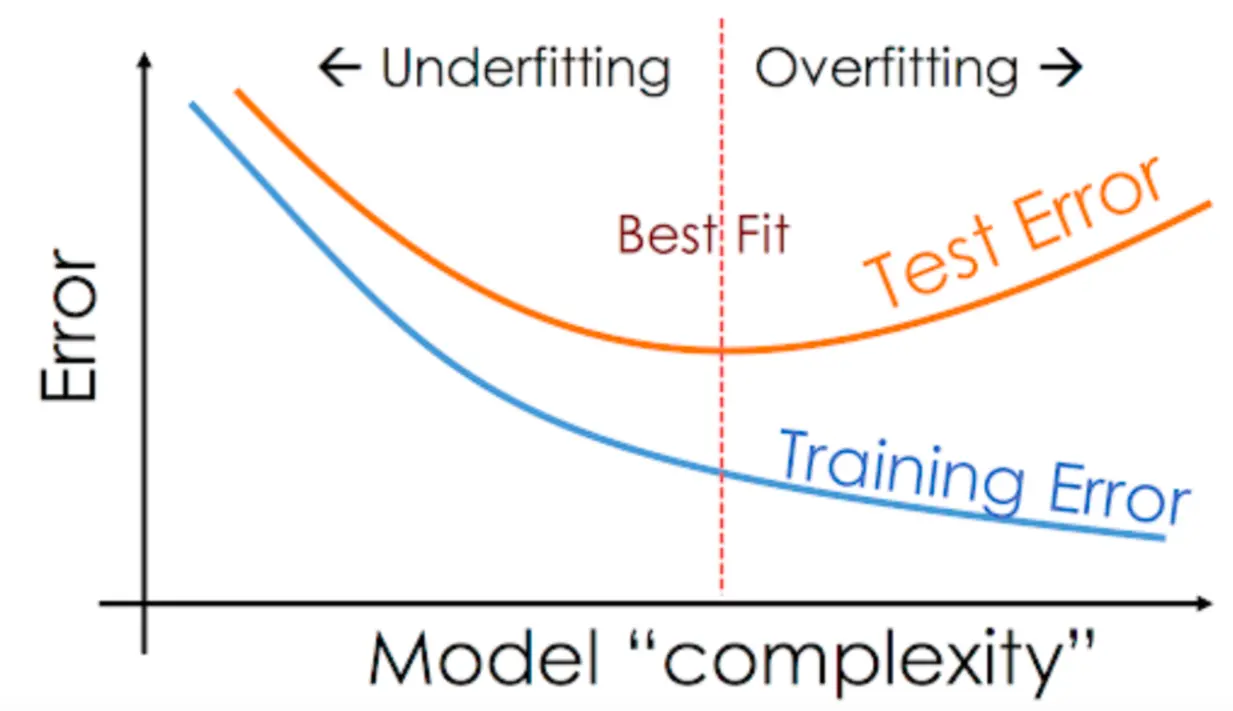
Overfitting occurs when the predictive model is very accurate within the training data but fails in predictive strength on the validation set. One interpretation on overfitting suggests the model is too simple for the data and does not account for other important variables.
Underfitting describes a model that can’t accurately capture the relationship between input and output variables. One simple example of this is when a model is too simple for the underlying data (i.e. a linear model is used when the data might not be suitable for a non-linear problem). Here, the data is too complex for the model.
A helpful way to illustrate these concepts is to show a few charts which exhibit overfitting and underfitting.

Regardless of the models used, they must all satisfy some basic requirements:
- They must not exhibit bias
- They must not have disparate impact between and within groups
- They must be legal and ethical in protecting privacy rights of all customers whose data is being used in the construction of the model
Analyzing Data Models with Lift Charts
A lift chart is a visual representation of how well the model performs across a data set. Typically, data can be segmented into equally apportioned groups (i.e. buckets) where output values are assigned to each group. Often, groups or buckets are divided into sets of 10 (deciles), 5 (quintiles), 4 (quartiles), and the like. When a pattern emerges, say, from lowest to highest, we say the lift is some factor X of lift. Here’s a good illustration:
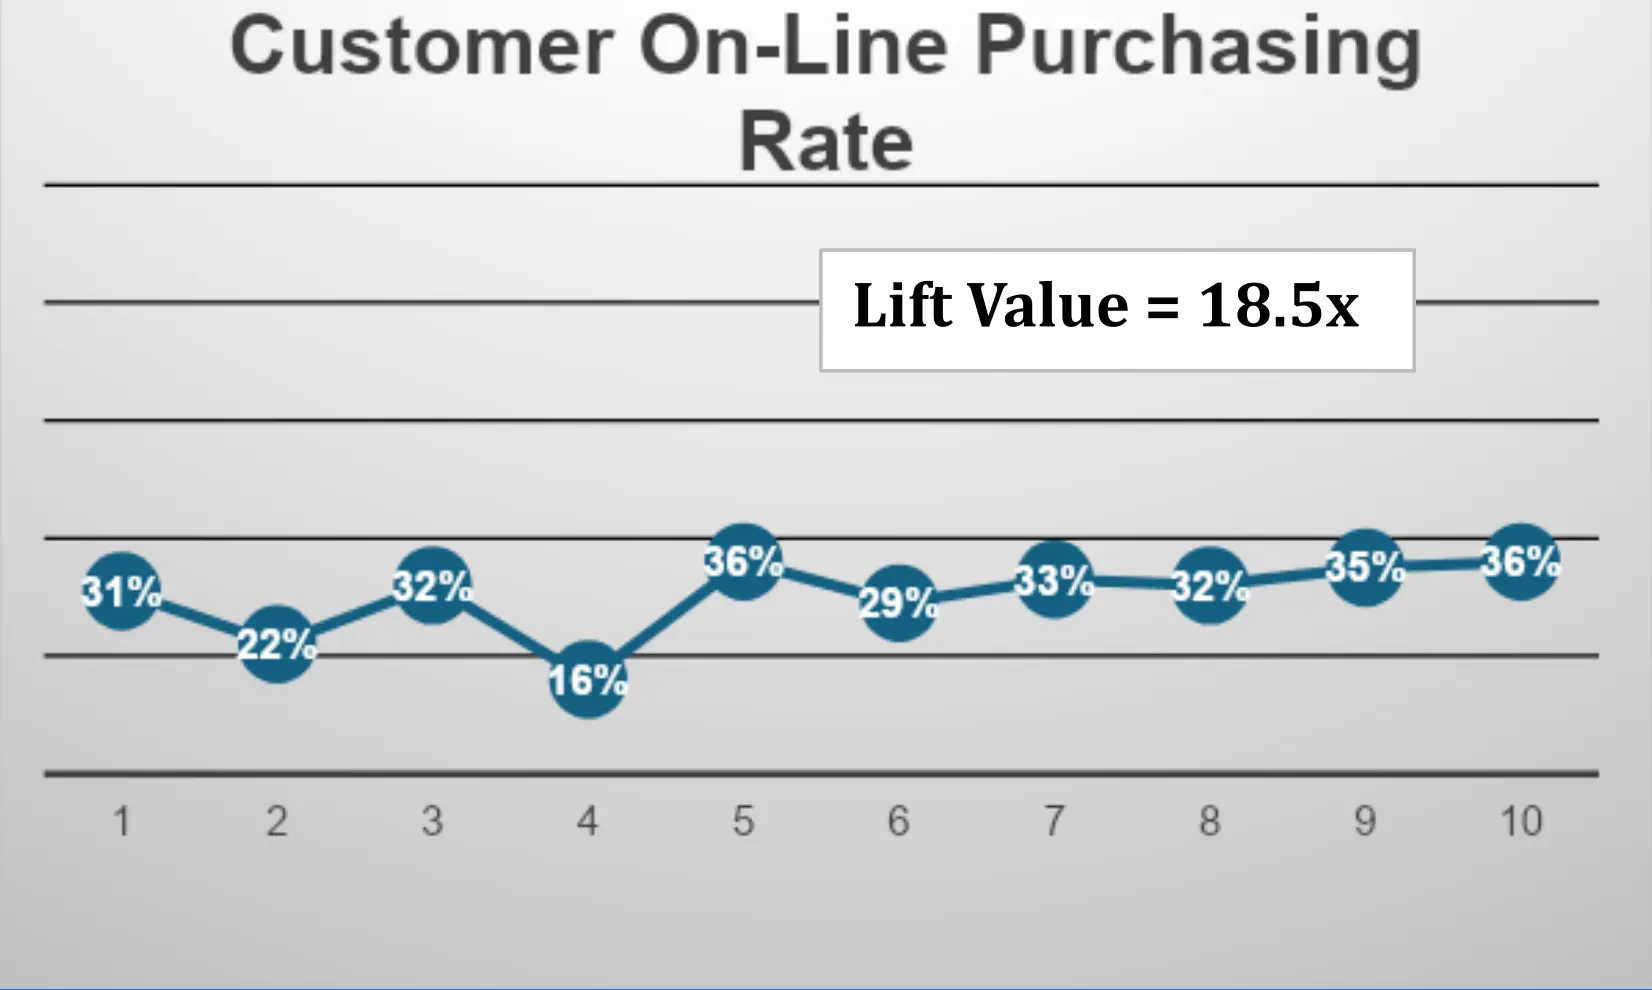
An online products company wants to gain more insight into identifying and targeting customers who prefer to make purchases using company online shopping applications.
In the general population, only 2% of all customers routinely make purchases online. So, the company hires a data scientist to see if there is a way of collecting specific data that will help improve the company’s targeting effort.

From the above chart, the data scientist constructs a model which captures a large volume of online customer purchasing data and drops it into deciles (i.e. 10 buckets) as shown above.
As we can see from about the 7th decile and above, the lift rate is several multiples of the base line of 2%. In this example, the company would want to explore more about the characteristics of customers in these deciles. This is an example where the model shows a definite upward trend in predictive capability and can be useful to a business using it.
Here is an example where a model does not exhibit much predictive capability.

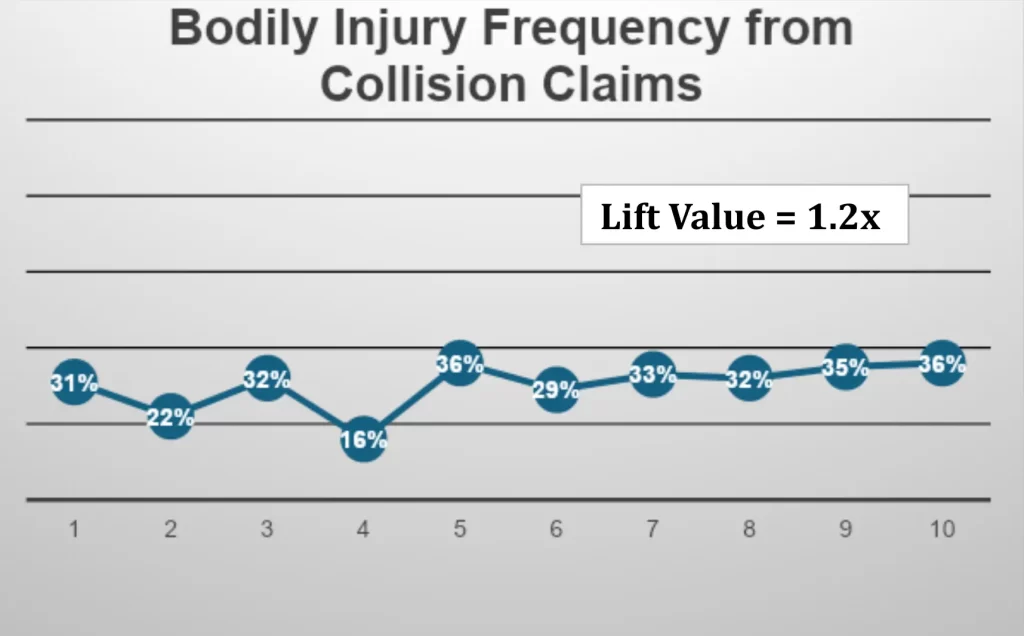
In the above exhibit, an insurance company is looking to construct a model that will provide predictive capability in identifying customers or accident circumstances where there is bodily injury involved.
They pull large volumes of frequency and loss data and construct a model which they hope will provide predictive insight into preventing and/or better managing claims where there is bodily injury.
In this example, the base line for all collision claims involving bodily injury is 30%. This is a relatively high base line. Recall, the online purchasing base line was only 2%. So, the upper deciles (i.e. 7,8,9 and 10) show modest increases above the base of 30%. The lift value here (36/31) = 1.2 is not significant or a strong enough predictor to be used the way the insurance company was hoping.
Generally, lift values should exceed 1.5x (highest to lowest decile) to be useful for predictive purposes.
What should this insurance company do? They could consider taking the following steps:
- Collect additional claims, loss, and accident data from other sources
- Consider whether there are regional influences by segmenting data in this way
- Reestablish a new baseline by refining bodily injury claims that, for example, exceed a certain severity threshold.
This is a simple example of how actuaries and data scientists are using data to construct models to help grow business, reduce expenses, target customers, enhance customer experience, fill knowledge gaps, and improve profitability.
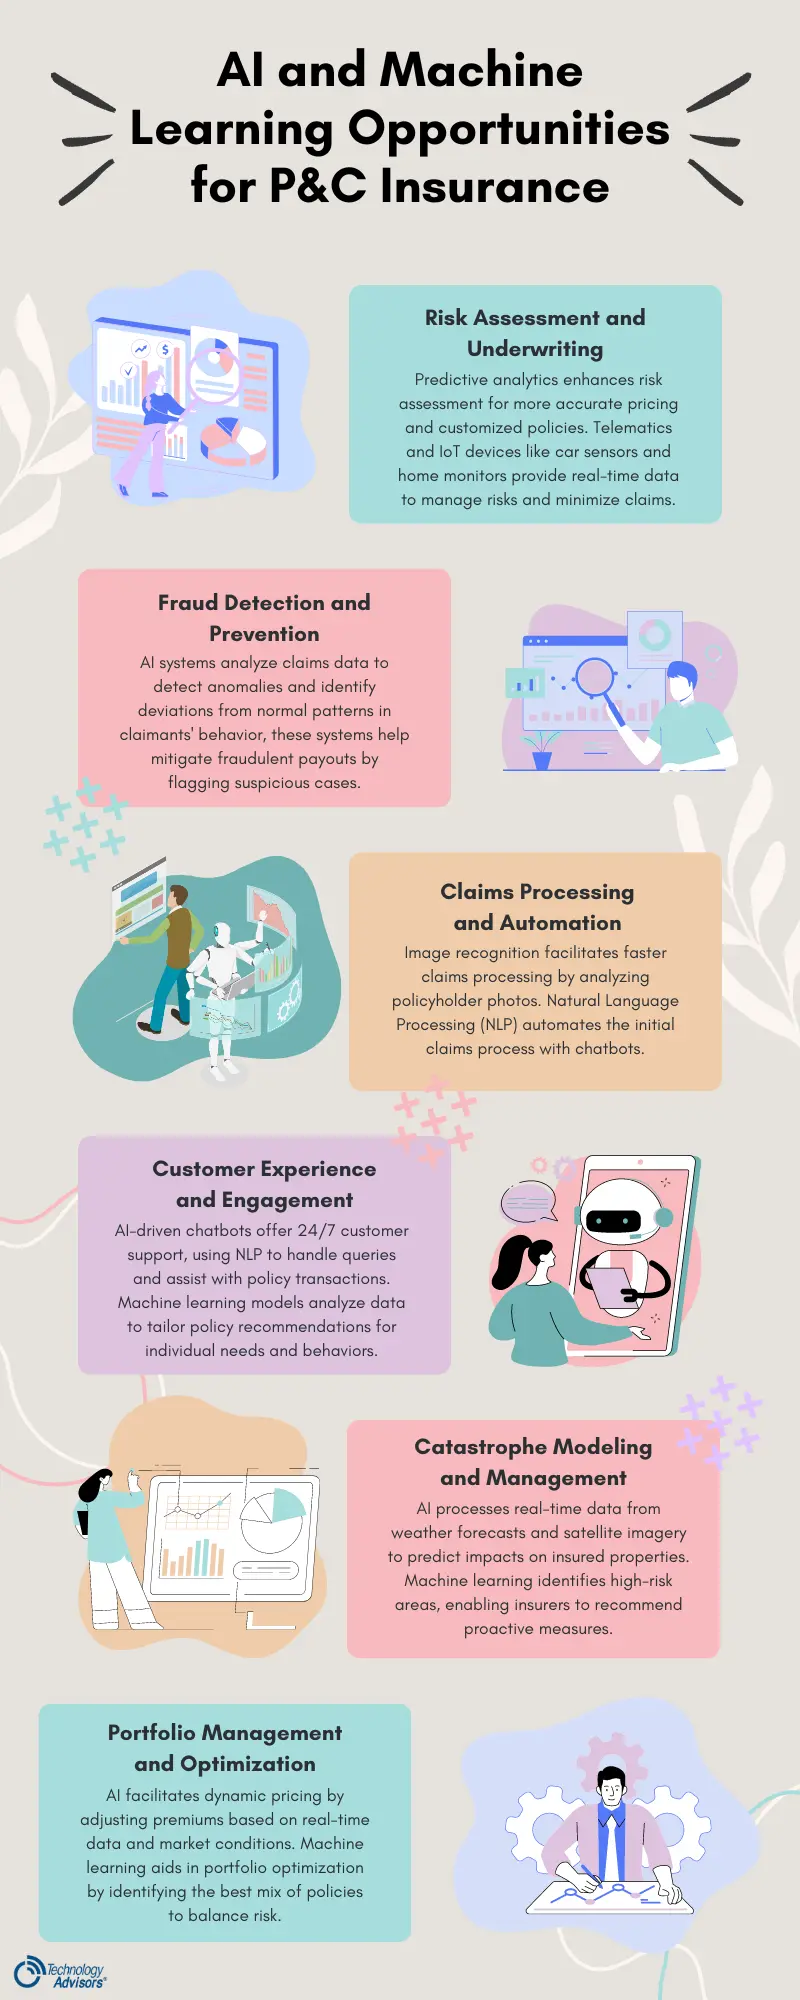
AI and Machine Learning Opportunities for P&C Insurance

1. Enhanced Risk Assessment and Underwriting
Predictive Analytics
Telematics and IoT
2. Fraud Detection and Prevention
Pattern Recognition
Behavioral Analytics
3. Claims Processing and Automation
Automated Claims Handling
Image Recognition
4. Customer Experience and Engagement
Personalized Customer Interactions
Tailored Recommendations
5. Catastrophe Modeling and Management
Real-Time Data Analysis
Risk Mitigation Strategies
6. Portfolio Management and Optimization
Dynamic Pricing Models
Risk Diversification
Harnessing AI and Machine Learning for Insurance
No matter the chosen approach, AI and ML models depend on large volumes of accurate, organized, and centralized data that is accessible for use when it’s needed. If there are deficiencies in any of these areas, the models will not be as accurate as they could be.
A single source of truth, where relevant customer data is pooled from disparate sources, must exist to begin this process. This is where we see many insurers adopting and integrating CRM.
For insurance companies, a CRM is not just a tool for managing customer relationships but a strategic asset that enhances the application of AI and machine learning.
CRMs consolidate diverse data sources, such as customer demographics, purchase history, and interaction logs. AI and ML models use this integrated data to enhance risk assessment processes, leading to more accurate underwriting and pricing models.
These applications also provide the real-time data processing necessary for AI models to detect anomalies and emerging trends that inform risk management.
Property and casualty insurers looking to fully harness AI and machine learning must consider a platform like CRM as an essential steppingstone on their analytical journey.


